How Hot Is My Chilli
Is the hotness related to size?
Load the data.
name,hotness,"size in cm"
"Poblano verde",3,10.2
"Poblano Rojo",3,13.5
Pimento,1,9.8
"Anaheim Red",2.5,15.2
"Anaheim Green",2.5,15.2
Chilaca,3.5,21.7
"New Mexico Red",3.5,13.6
"New Mexico Green",3.5,15.4
"Peter Pepper",7.5,11
"De Agua (Red)",4.5,11.7
"De Agua (Green)",4.5,10.9
Chawa,3.5,10.4
"Dutch Red",6,9.9
"Thai Green",7.5,9.2
"Thai Red",7.5,8.7
Guero,6,7.5
"Red Jalapeno",5.5,6.9
"Green Jalapeno",5.5,6.8
Manzana,5.5,7
"Orange Habanero",10,5
"Green Habanero",10,4.7
"Hungarian Cherry",1,3.6
Rocotillo,9,3.1
"Scotcho Bonnet",9.5,3.6
"Red Fresno",6.5,4.8
"Green Serrano",7,3.2
"Red Serrano",7,4.1
"Ornamental Cayenne",6.5,3.6
Macho,10,2.2
Tepin,8,1.1
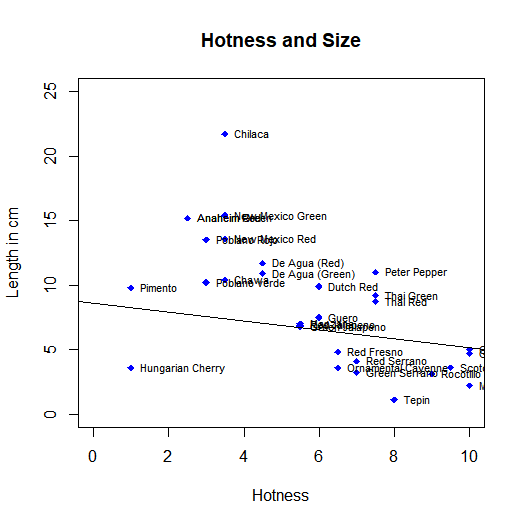
Scatter plot and correlation. There seem to be some outliers, which I removed. The correlation then goes up to 0.77.
# Load the chillis and take a look
chillis <- read.csv(file="./01-chillis.csv", header=TRUE, sep=",")
plot(chillis$hotness, chillis$size.in.cm,
main="Hotness and Size",
xlab = "Hotness", xlim=c(0, 10),
ylab = "Length in cm", ylim=c(0, 25),
col="blue", pch=18)
abline(lm(chillis$hotness ~ chillis$size.in.cm))
text(chillis$hotness, chillis$size.in.cm, labels = chillis$name, cex=0.7, pos=4)
# What is the correlation?
cor.test(chillis$hotness, chillis$size.in.cm, method="pearson")
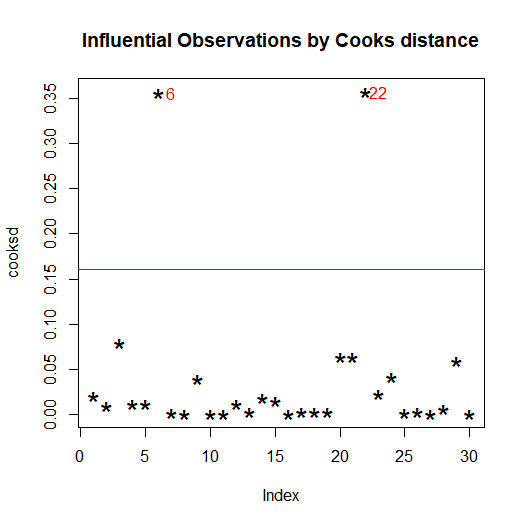
# Maybe we should remove outliers using Cooks distance
mod <- lm(chillis$hotness ~ chillis$size.in.cm, data=chillis)
cooksd <- cooks.distance(mod)
plot(cooksd, pch="*", cex=2, main="Influential Observations by Cooks distance")
abline(h = 4*mean(cooksd, na.rm=T), col="red")
text(x=1:length(cooksd)+1, y=cooksd, labels=ifelse(cooksd>4*mean(cooksd, na.rm=T),names(cooksd),""), col="red")
influential <- as.numeric(names(cooksd)[(cooksd > 4*mean(cooksd, na.rm=T))]) # influential row numbers
# Remove the influential and check the correlation
chillis <- chillis[-influential,]
cor.test(chillis$hotness, chillis$size.in.cm, method="pearson")
Results in this.
Pearson's product-moment correlation
data:  chillis$hotness and chillis$size.in.cm
t = -6.3295, df = 26, p-value = 1.058e-06
alternative hypothesis: true correlation is not equal to 0
95 percent confidence interval:
 -0.8925128 -0.5717768
sample estimates:
       cor
-0.7787363
So yeah, the small ones are hotter.
Written on January 31, 2018